-
Academic Report Writing
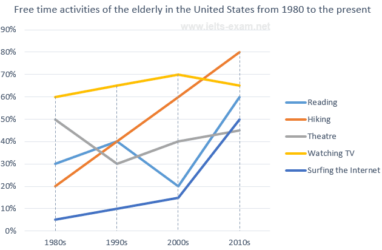
Posted by NIL Admin on August 23, 2021 at 10:59 PMThe graph below shows how elderly people in the United States spent their free time between 1980 and 2010.
Summarise the information by selecting and reporting the main features, and make comparisons where relevant.
Falak replied 2 years, 10 months ago 6 Members · 8 Replies -
8 Replies
-
The graph illustrates the amount of time people invest in various activities for passing time in US.it can be seen that the favourite activity enjoyed by elder people is watching TV ,which was surpassed by hiking after 2000s ,with the least time spent in surfing the Internet in 1980s which was replaced by theatres in 2010 .
it can be observed from the the graph ,that watching TV was the favourite pastime of older people in 1980s ,which remained at the top up to 2000s but coincided with hiking between 2002 to 2010 ,after which hiking became the activity that people love the most. theatre made second in list followed by reading in which a lot of fluctuation can be seen over the years.
it is crystal clear that all the activities other than watching TVand theatre have seen overall increase in number .however ,TV still remains at the top even after a decrease in popularity after 2000 .steady increase in hiking is seen over the years compared to surfing in which a gradual increase was followed by steep rise in 2000.
-
Everything written perfectly well, however in the conclusion paragraph you said that the TV still remains a top but it does not hiking surpassed watching television with almost a 15% gap.
Except this one point, this is very well written report and deserves compliments.
Band score weightage: 2.5/3.0
-
-
The time graph illustrates the free hours expend by elderly people on five different activities in the specific country United States from 1980 to 2010.
Overall, the hiking activities had rocketed in comparison to other pastime. Moreover, reading had seen quite ups and downs over the period given.
As from the chart it is lucid that between 1980s to 2010, the hiking activity rose considerably from a fifth to four fifth. While surfing the internet stood at approximately 5% in 1980s and there was a marginal growth just above one in ten by the end of century. By the start of the 2000s it surged significantly and reached half by the end of 2010s. On the contrary watching television remained roughly around three fifth at the start of 1980s until the end of 2010s, while there was a peak observed around 2000s to less than 3 quarters. The theatre dipped over the given timeframe from half to 30 percent in a decade, then there was a slight increase till end of the next decennium around 40% and remained just above it by the end of 2010s. Moreover, the reading which stood exactly at 30% in 1980s climbed to two fifth in next ten years than slipped back to one fifth in 2000s, then over the next decade soared dramatically to more than half.
Lastly, we can conclude that all the activities remained approximately between 45 percent to four fifth by the end of 2010.
-
The line graph represents leisure time spend by older people in reading, hiking, theatre, watching Tv, and surfing the internet in the United states for the last 30 years.
Overall, the graph depicts fluctuation at the beginning of the period but at the end, the figure fell between 45-60%. However, watching TV was among the most favourite way of time-pass through the tenure.
In the early stage, surfing the internet was not popular amount groups with only 5% of people were using the platform but subsequently, in 1990s and till 2010s it had shown a steadily increased with half of the audience attraction. Moreover, reading on other hand went through a huge fluctuation with 30% initially and closed at 60% which was almost double over the period.
In addition, hiking was the only activity which had indicated a tremendous jumped started with 20% in the beginning and attract the majority of elder people in 2010s. Furthermore, theatre marked 50% in 1980s and dropped down at 30% in 1990s and again maintained steady growth in the remaining years. Watching TV was a highly viewed activity in 1980s and 2000s but it had plummed down in 2010s.
The charts depict a crystal clear image of hiking being the most lovable activity in 2010s compared with other activities. -
@falak Here is my Task 1:-
The graph illustrates information about activities in percentagewise, performed by older people in their leisure time from 1980s to 2010s in America.
Overall, it can be clearly observed that hiking is the most frequent activity done by elders, as it spiked rocketly. Whereas, other activities like Reading, watching TV, Theatre and Surfing the internet showed some kind of fluctuations.
Among them, there was the only one activity(i.e Hiking) which went up drastically from 20% in 1980 to 80% in 2010 without any hiccups. However, reading and theatre fluctuated multiple times while crossing each other path in proportion, where both acted contrastingly from beginning (30% and 50%) to end (60% and 45%) over three decades. Lastly, there was a similar trend between remaining activities (Watching TV & Surfing the internet) initially, as both raised up with 10% of difference from 1980s till 2000s, but then ended up in contradictory direction with almost 65% and 50% in 2010s.
-
Feedback : Overall could be more meticulous ; it is not clarifying the picture, hence purpose is not served.
Band : 1.5/3
-
Log in to reply.


