
Tagged: @falak
-
Academic Task -1 ( Batch B -8 pm) Car theft in four countries
Posted by Unknown Member on September 3, 2021 at 1:37 PMYou should spend about 20 minutes on this task.
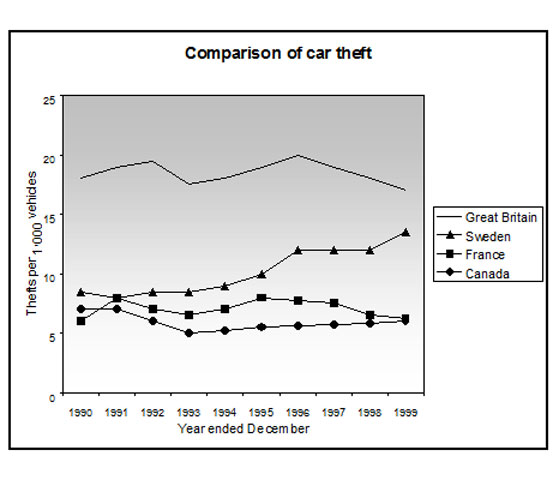
The line graph shows thefts per thousand vehicles in four countries between 1990 and 1999.
Summarize the information by selecting and reporting the main features and make comparisons where relevant.
Write at least 150 words.
 Line Graph Comparisons of Car TheftVimy replied 4 years, 4 months ago 19 Members · 35 Replies
 -
35 Replies
 Line Graph Comparisons of Car Theft
-

Unknown Member
Deleted UserSeptember 4, 2021 at 10:28 PMThe
graph provides information regarding thefts per thousand for vehicles in Great Britain, France, Sweden, and Canada from 1990 to 1999. Overall, the thefts have declined for Great Britain, France, and Canada whilst it rose for Sweden throughout.Great Britain has stayed at the pinnacle for thefts than all other countries for a decade. In 1990 France and Canada stood well below that of Great Britain at just around 8 and 7 thefts respectively opposite to approx 17 thefts. Moreover, a similar trend has been shown by Great Britain, France, and Canada with having an almost constant difference of about 10 thefts each year. Great Britain in 1990 ended up striking the lowest thefts of around 14 per thousand.
Sweden Started with its lowest figure of approx 5 thefts in 1990. It kept rising since and stood at the same mark as France of around 6 thefts in 1991. Over the decade, the difference between thefts for Great Britain and Sweden shrunk down by almost five times the previous value.
-
The graph provides information regarding thefts per thousand for vehicles in Great Britain, France, Sweden, and Canada from 1990 to 1999. Overall, the thefts have declined for Great Britain, France, and Canada whilst it rose for Sweden throughout.
Great Britain has stayed at the pinnacle for thefts than (among) all other countries for a decade. In 1990 France and Canada stood well below that of Great Britain at just around 8 and 7 thefts respectively (as) opposite (opposed) to approx (approximately) 17 thefts ( in Great Britain). Moreover, a similar (downward) trend has been shown by Great Britain, France, and Canada with having an almost constant difference of about 10 thefts each year. Great Britain in 1990 ended up striking the lowest thefts of around 14 per thousand.
Sweden Started with its lowest figure of approx (approximately)5 thefts in 1990. It kept rising since (then) and stood at the same mark as France of around 6 thefts in 1991. Over the decade, the difference between thefts for Great Britain and Sweden shrunk down by almost five times (one –fifth of) the previous value.
Observations :
Please see the corrections above in bold.
1. Superlative will never take ‘than’ which is only used for comparative {the pinnacle for thefts than (among)}
2. Informal language should be avoided which includes short forms like ‘approx’
3. Comparisions should be clear with the names of the countries clearly written
4. Similar downtrend should be clearly stated as ‘downward’ or ‘upwards’.
5. Increased by 5 times and shrunk to one –fifth / shrunk down by four-fifths
6. As opposed to – in contrast with.
Feedback:
The answer has an appropriate introduction which the candidate has attempted to express in his/her own words. There is good coverage of the data and a brief reference to contrasting trends. The answer can be followed although only limited cohesive devices have been used. In order to gain a higher mark for content, the candidate would be expected to select the salient features of the graph and comment primarily on these. The grouping is not very clear from the paragraphs which needs to be illustrated well. Use of informal words like ‘approx’ should be avoided and fractional phrases have been used inappropriately in places.
Band Score : 2/3
-
-
Unknown Member
Deleted UserSeptember 5, 2021 at 11:52 AMThe given line graph illustrates the theft per thousand cars in Great Britain, Sweden, France and Canada for a time period between 1990 to 1999. Car theft in Sweden increased over the given time frame while the number of thefts remained same throughout Canada, Great Britain and France depicting slight fluctuations.
Thefts in Sweden were around 8000 in the early years of the given time. In the year 1991 Sweden and France had the same number of cases occurring. Sweden reached its highest point (over 13000) by the end of the year 1999.
Great Britain has topped the list by maintaining a higher range of theft thought the entire time. It had fluctuated heavily thought the period. Theft here was over 17000, which was almost the same during the start and the end. The Sweden’s highest recorded count was almost 4000 thefts lower to that of Great Britain. France maintained it’s count around 5400 while Canada fluctuated around 6000.
-
The given line graph illustrates the theft per thousand cars in Great Britain, Sweden, France and Canada for a time period between 1990 to 1999. Car theft in Sweden increased over the given time frame while the number of thefts remained (almost) same throughout Canada, Great Britain and France depicting slight fluctuations.
Thefts in Sweden were around 8000 (8) in the early years of the given time (period). In the year 1991 Sweden and France had the same number of cases occurring. Sweden reached its highest point (over 13000) (over 13) by the end of the year 1999.
Great Britain has topped the list by maintaining a higher (highest) range of theft thought the entire time (period). It had fluctuated heavily thought the period. Theft here was over 17000 (17), which was almost the same during the start and the end. The Sweden’s highest recorded count was almost 4000 (4) thefts lower to that of Great Britain. France maintained it’s (its) count around 5400 ( wrong data )while Canada fluctuated around 6000.
Feedback:
Please rewrite the answer as the data deciphered from the chart is incorrect. The answer is not up to the mark with ample of mistakes in tenses/ pronouns/ and comparatives.
-
-
Unknown Member
Deleted UserSeptember 5, 2021 at 4:05 PMThe line graph illustrates the number of car robberies per thousand vehicles that took place in Great Britain ,Sweden,France and Canada over a period of ten years from 1990.Overall ,Great Britain appears to have witnessed the largest number of thefts throughout the given period.
France and Canada which began from figures of approximately 8 and 7 per thousand respectively declined to a final figure of around 5 per 1000 in 1999 with minor fluctuations over the period.At the same time,the number of car robberies in Great Britain grew up from about 17per 1000 to the peak value of approximately 20per 1000 in 1996except for a brief fall during 1992-1993.This was followed by a decline of about 3per 1000 vehicles by 1999.
In contrast to this , Sweden, which started off from the lowest figure of just above five in 1990 showed an increasing trend to reach at the final rate of nearly 14 per thousand vehicles after going through slight variations and surpassing France and Canada in mid-1990 and 1991 respectively.
-
The line graph illustrates the number of car robberies per thousand vehicles that took place in Great Britain, Sweden, France and Canada over a period of ten years from 1990. Overall , Great Britain appears to have witnessed the largest number of thefts throughout the given period.
France and Canada which began from figures of approximately 8 and 7 per thousand respectively declined to a final figure of around 5 per 1000 in 1999 with minor fluctuations over the period. At the same time, the number of car robberies in Great Britain grew up from about 17per 1000 to the peak value of approximately 20per 1000 in 1996 except for a brief fall during 1992-1993.This was followed by a decline of about 3per 1000 vehicles by 1999.
In contrast to this , Sweden, which started off from the lowest figure of just above five in 1990 showed an increasing trend to reach at the final rate of nearly 14 per thousand vehicles after going through slight variations and surpassing France and Canada in mid-1990 and 1991 respectively.
Feedback:
Well attempted! The answer is well written and contains some good arguments. Point of view remains clear throughout. The message is easy to follow and ideas are arranged well with good use of cohesive devices. There is good coverage of the data and a brief reference to contrasting trends. There is a wide range of structures that are well handled with only small problems in the use of vocabulary, mainly in the areas word choice.
Band Score: 2.5/3
-
-
Unknown Member
Deleted UserSeptember 6, 2021 at 4:24 PMThe line graph illustrate about the comparison of car theft per thousand vehicles in Great Britain, Sweden, France, Canada from 1990 to 1999.Overall Sweden experienced a upward trend throughout the period. While there are some fluctuation in case of Great Britain, France and Canada.
Around 1990 the car theft of France and Canada were nearly 7000 and 8000 respectively. In 1991 France and Canada was outraced by Sweden. In the meantime Great Britain saw a rapid increase in car theft till late 1992.In late 1996 Great Britain reached it’s peak to around 20,000 and then dramatically declined to around 1600 by the end of 1999.In the early 1994 car theft gradually increase in France and Canada but was lowest at the end of the period as compared to Great Britain and Sweden
In the late 1990 Sweden has the lowest car theft rate among the three countries. However it increase sharply during the period of 1990 to 1996 Then it remained steady till 1998.After that there was a growth in car theft of around 1000 in the late 1998.By the end of the period car theft in Sweden was higher then France and Canada.
-
Piyush the data described is incorrect. It is thefts per thousand and not thefts in thousands, Pls check the figures again and rewrite your answer.
-
-
Unknown Member
Deleted UserSeptember 6, 2021 at 5:45 PMThe line graph represent burglary of motor vehicles that took place in Great Britian, Sweden, France and Canada over the past 10 years. Overall, it is noticed that Great Britain have highest robbery per 1000 vehicles between 1990-1991.
To begin with, in 1990 Sweden, France and Canada had indicated the numbers of theft per 1000 car were between 5 to 10, while in 1991 Sweden had zero cases whereas France and Canada pointed 5700 and 5500 cases of robberies. Although in 1992, Sweden had experienced a constant numbers of burglary cases, while France and Canada figures slightly dropped down by a small fractions. It was viewed in the period 1993 and 1994, the figures was consistent but in 1995 the robbery cases in Sweden, France and Canada raised slightly.
Sweden touched approximately 13000 cases in 1996, whereas France and Canada registered cases shrinked about 5500 and 5200 respectively.Since, year 1997 to 1999, Sweden surpassed the robbery cases rate. However, Sweden outraced France and Canada by reflecting more than three time cases . France on other hand, plummeted from 5700 to just 5200 cases.
In the end, Great Britain registered excessively high theft cases in 1992 and 1996 as compared with other three nations. Great Britain in 1993 and 1999, experience a dipped in robbery of cars, while in 1999 Sweden climbed approximately 14 per 1000 cases.
-
Unknown Member
Deleted UserSeptember 6, 2021 at 11:40 PMThe graph illustrates the thefts of per thousand vehicles in Great Britain, Sweden, France, Canada from year 1990 to 1999. Overall, Great Britain witnessed the highest robbery per thousand vehicles initially as compared to other three countries.
Initially France and Canada’s vehicle robbery witnessed 7 to 8 per thousand vehicles seeing a downward trend with minor fluctuations over 10 years. At the same time, vehicle robbery in Great Britain hit the highest of all seeing a fluctuation but still staying all time high of approximately 14 robbery per thousand vehicle till the end of the period.
In contrast, Sweden who started from 4 per thousand vehicle robbery that is the lowest of all times witnessed an upward trend outracing France & Canada mid way in 1991 to reach a rate of approximately 14 per thousand vehicles over a decade.
-
The graph illustrates the (car) thefts of per thousand vehicles in Great Britain, Sweden, France, Canada from year 1990 to 1999. Overall, Great Britain witnessed the highest (car) robbery per thousand vehicles initially as compared to other three countries.
Initially France and Canada’s vehicle robbery witnessed (robbery of )7 to 8 (cars) per thousand vehicles seeing a downward trend with minor fluctuations over 10 years. At the same time, vehicle (car) robbery in Great Britain hit the highest of all seeing a fluctuation but still staying (at an) all time high of approximately 14 robbery per thousand vehicle till ( at) the end of the period.
In contrast, Sweden who (which) started from 4 per thousand vehicle( car) robbery that is (was) the lowest of all times (among all) witnessed an upward trend outracing France & Canada mid way in 1991 to reach a rate of approximately 14 per thousand vehicles over a decade.
Observations:
Please see the corrections above in bold.
1. Thefts of per thousand vehicles – Thefts per thousand vehicles
2. Great Britain witnessed the highest robbery throughout and not just initially.
3. Great Britain hit the highest of all seeing a fluctuation but still staying (at an) all time high of approximately 14 robbery per thousand vehicle till ( at) the end of the period. – This sentence is describing the data incorrectly.. Great Britain hit an all time high of approximately 20 thefts per vehicle in the year 1996 which plummeted to approximately 14 in the end of the period.
4. ‘who’ is used for living beings and which is used for non – living.
Feedback:
It was a good attempt but the response to the question is not long enough. For Task 1 candidates must write at least 150 words but this answer is below that number. The writing is presented in a satisfactory format. Full sentences are used but in some places the data described is incorrect. It uses a limited range of vocabulary to present the information. The writer shows some awareness of sentence structure however, there are frequent grammatical errors throughout the answer. Pronoun errors who/which can be seen and in some places sentence formation needs improvement.
Band Score : 1.5/3
-
-
Unknown Member
Deleted UserSeptember 7, 2021 at 2:36 PMThe line graph illustrates the rate of vehicle theft per thousand in Great Britain, Sweden, France, and Canada from 1990 to 1999.
Overall, the car theft rate of Great Britain and Canada showed a tiny decrease in 10 years despite their fluctuations while Sweden experienced an upward trend. And France remained the same.
During the period, Great Britain stayed far above of all the countries and has been experiencing the highest rate in comparison to France, Canada, and Sweden. In 1990, both Great Britain and France increased sharply and stood approximately at 19 and 8 (respectively) after that Great Britain kept climbing up while France declined.
Sweden started with a small drop and after intersecting with France at about 8, it started accelerating and finally reached 14.
France and Canada initiated nearly at 6 and 7 thefts per millenary(respectively) then both crossed each other and in the post-1991 time they followed a parallel change and ultimately ended up at the same point which is close to 6 thefts per thousands.
Word count: 170
-
The line graph illustrates the rate of vehicle theft per thousand ( car theft per thousand vehicles) in Great Britain, Sweden, France, and Canada from 1990 to 1999.
Overall, the car theft rate of Great Britain and Canada showed a tiny decrease in 10 years despite their fluctuations while Sweden experienced an upward trend. And France remained the same.
During the period, Great Britain stayed far above of all the countries and has been experiencing ( experienced)the highest rate (theft) in comparison to France, Canada, and Sweden. In 1990, both Great Britain and France increased sharply and stood approximately at 19 and 8 (respectively) after that Great Britain kept climbing up while France declined.
Sweden started with a small drop and after intersecting with France at about 8 (thefts) , it started accelerating and finally reached 14 (thefts) .
France and Canada initiated nearly at 6 and 7 thefts per millenary thousand vehicles (respectively) then both crossed each other and in the post-1991 time they followed a parallel change and ultimately ended up at the same point which is close to 6 thefts per thousands.
Word count: 170
Observations :
Pls see the inaccuracies above in bold.
1.rate of vehicle theft per thousand – ( car theft per thousand vehicles)
2.Overall, the car theft rate of Great Britain and Canada showed a tiny decrease in 10 years despite their fluctuations while Sweden experienced an upward trend. And France remained the same. – The data described is incorrect. Grouping is improper.
France ,Canada and Great Britain can be grouped and Sweden can be talked about separately. Even France does not remain the same.
3.far above of all the countries – far above all the countries
4. has been experiencing ( experienced)the highest rate (theft)
5. the language used is not clear and is confusing the reader.
Feedback :
Though a good attempt has been made to write the answer but the data described in the 2nd para is incorrect. Organization is satisfactory but the language used and the data described is not clear. There are some good vocabulary words but collocation errors are evident like ‘far above of all’. Tenses have been incorrectly used in some places ( see above). Sentence formation needs improvement which is rendering the meaning of the sentences ambiguous.
Band Score: 1.5/3
-
-
Unknown Member
Deleted UserSeptember 8, 2021 at 12:42 AMThe presented graph compares thefts per thousand vehicles in Great Britain, France, Sweden and Canada for 10 years period from 1990 to 1999. It can be clearly seen that, throughout the period, in Sweden, the numbers of car theft was rising whereas the rates of theft in Great Britain, France and Canada had some oscillation.
According to the graph, in 1990, the number of car theft of the France and Canada were nearly 6000 and 7000 respectively, whilst in Great Britain, the number was almost double than these countries in the same year. Over a decade, with some fluctuations in numbers of car theft in these three countries, Great Britain remained at the top with approximately 14000 while Canada and France were at the bottom with about 50% than that of Great Britain.
On the other hand, though Sweden had about 1000 more car theft than Canada in 1990, it experienced rapid surge over the years and reached 1.5 times more increment in the end of the period.
Total words: 167
◦
-
The presented graph compares (car) thefts per thousand vehicles in Great Britain, France, Sweden and Canada for 10 years period from 1990 to 1999. It can be clearly seen that, throughout the period, in Sweden, the numbers of car theft (number of car thefts) was rising whereas the rates (rate) of theft in Great Britain, France and Canada had some oscillation (fluctuation).
According to the graph, in 1990, the number of car theft of the (not required) France and Canada were nearly 6000 (6) and 7000 (7) respectively, whilst in Great Britain, the number was almost (more than)double than these countries in the same year. Over a decade, with some fluctuations in numbers of car theft in these three countries, Great Britain remained at the top with approximately 14000 (14) while Canada and France were at the bottom with about 50% (less) than that of Great Britain.
On the other hand, though Sweden had about 1000 (1)more car theft than Canada in 1990, it experienced rapid surge over the years and reached 1.5 times more increment in the end of the period.
Total words: 167
Observations:
Pls see the inaccuracies in bold above with corrections in the brackets.
1. Per 1000 = the number itself
2. In 1000s = in units of thousands
3. So all the numbers are in single numbers and not thousands.
4. numbers of car theft – ( number of car thefts )
5. rates of theft – rate of theft
6. almost double – almost more than double
Feedback:
It is well structured and organized though the numeric data deciphered from the graph is inaccurate. A good effort has been made to answer the question and describe the main points in the charts though the grouping could have been varied for a better understanding and comparision. Range and vocabulary are satisfactory with good use of language of variation. Minor Grammar errors of singular/plural are seen which does not detract the flow of the writing.
Band Score : 1.5 / 3 ( only because of wrong data)
-
-
Unknown Member
Deleted UserSeptember 8, 2021 at 5:53 PMThe line graph illustrates the number of car robberies per thousand vehicles in Great Britain, Sweden, France, and Canada from 1990 to 1999. Overall, Great Britain experienced the highest number of vehicle thefts as compared to other countries over the given period.
In 1990 the car thefts of France and Canada were approximately 8 and 7 thefts per thousand respectively. Both the countries followed a downward trend in the number of vehicles being stolen over the period and reached a final figure of around 6 per 1000 in 1999. In contrast, Sweden started at around 5 per thousand vehicle robberies, experienced an upward trend outracing both France and Canada in 1992 and finished at a rate of approximately 14 per 1000 over the period.
Great Britain started at approximately 17 per 1000, which was more than that of other countries. It experienced fluctuations over the time period, reached at a peak of 20 per thousand in 1996 and ended up being a slightly lower figure of 16 per 1000 by 1999.
-
The line graph illustrates the number of car robberies per thousand vehicles in Great Britain, Sweden, France, and Canada from 1990 to 1999. Overall, Great Britain experienced the highest number of vehicle thefts as compared to other countries over the given period.
In 1990 the car thefts of France and Canada were approximately 8 and 7 thefts per thousand respectively. Both the countries followed a downward trend in the number of vehicles being stolen over the period and reached a final figure of around 6 per 1000 in 1999. In contrast, Sweden started at around 5 per thousand vehicle robberies, experienced an upward trend outracing both France and Canada in 1992 and finished at a rate of approximately 14 per 1000 over the period.
Great Britain started at approximately 17 per 1000, which was more than that of other countries. It experienced fluctuations over the time period, reached at a peak of 20 per thousand in 1996 and ended up being a slightly lower figure of 16 per 1000 by 1999.
Feedback :
The response is well written and contains some good arguments. Point of view remains clear throughout. The message is easy to follow and ideas are arranged well with limited use of cohesive devices. There is a wide range of structures that are well handled Sentence range and Grammar is almost error free. Language of comparision and contrast has been used throughout making it a well written piece of writing.
Band Score : 2.5/3
-
-
Unknown Member
Deleted UserSeptember 13, 2021 at 5:17 PMThe line graph illustrates thefts per thousand vehicles in four countries namely Great Britain, France, Canada, and Sweden between the years 1990 and 1999. Overall it can be seen that Great Britain saw the highest number of thefts throughout the period.
Sweden, France, and Canada had approximately the same number of thefts in the year 1990 but there was a sharp increase in thefts in Sweden from the year 1966 to 1999 and the thefts rose from around 6000 in the year 1990 to nearly 14,000 thefts in the year 1999. While France and Canada showed around the same trend throughout the period.
Great Britain had the highest amount of thefts of the other three countries. The number of thefts in 1990 was about 17,000 which increased significantly in the year 1992 and then it showed a downward trend in the year 1993 and from there it again showed a slight increase to about 20,000 thefts in the year 1996 and then it sharply decreased to nearly 16,000 cases which were the lowest for Great Britain.
-
The line graph illustrates thefts per thousand vehicles in four countries namely Great Britain, France, Canada, and Sweden between the years 1990 and 1999. Overall it can be seen that Great Britain saw the highest number of thefts throughout the period.
Sweden, France, and Canada had approximately the same number of thefts in the year 1990 but there was a sharp increase in thefts in Sweden from the year 1966 to 1999 and the thefts rose from around 6000 in the year 1990 to nearly 14,000 thefts in the year 1999. While France and Canada showed around the same trend throughout the period.
Great Britain had the highest amount ( number) of thefts of ( among) the other three countries. The number of thefts in 1990 was about 17,000 which increased significantly in the year 1992 and then it showed a downward trend in the year 1993 and from there it again showed a slight increase to about 20,000 thefts in the year 1996 and then it sharply decreased to nearly 16,000 cases which were (was)the lowest for Great Britain.
Observations :
Please see the corrections above in bold.
1. Car thefts has nowhere been mentioned. Should have been written in the introduction.
2. Number of thefts
3. Among the other three countries.
4. Were/was
Feedback:
The main subject of the graph , ie. Car theft has not been mentioned throughout. Language of comparison and contrast has rarely been used. Vocabulary range has been sparingly used with some incorrect usage of words.
Grammar errors of was/ were and prepositions to be seen in the writing.
Band Score : 2/3
-
-
Unknown Member
Deleted UserOctober 21, 2021 at 3:23 PMThe line graph provides information about motor vehicle stealing in four different countries from 1990 to 1999.The figures mentioned are in theft per thousands vehicles.
Great Britain had the highest vehicle stealing throughout the years while Sweden showed an increasing trend. However, France and Canada stood lower with slight fluctuations
In France and Canada, nearly 8000 cars were stolen in the year 1990 which was twice lower than Great Britain. Following that, both countries had a slight fall in thefts for the next three years until 1993. Meanwhile, a sharp decline can be observed in Great Britain as well in the same year. After that, car robbery in Canada almost levelled off till 1999.France also reached to the same number at around 5000 after a slight rise over five years .
A significant number of thefts was reported in Great Britain in 1990 which was more than double of the other three countries. Starting from the lowest figure, Sweden outraced France and Canada in an upward direction and reached approximately 15000 in 1999,which was two times higher than France and Canada. With the exception of a steady decline and rise in 1993 and 1996 respectively, Great Britain experienced a steady drop in the number until 1999 which was roughly similar to the initial period.
-
The line graph provides information about motor vehicle stealing in four different countries from 1990 to 1999.The figures mentioned are in (of) theft per thousands vehicles ( thefts per thousand vehicles).
Great Britain had the highest vehicle stealing throughout the years while Sweden showed an increasing trend. However, France and Canada stood lower with slight fluctuations
In France and Canada, nearly 8000 (8) cars were stolen in the year 1990 which was twice (half than that of )lower than Great Britain. Following that, both countries had a slight fall in thefts for the next three years until 1993. Meanwhile, a sharp decline (in thefts) can (could )be observed in Great Britain as well in the same year. After that, car robbery in Canada almost levelled off till 1999.France also reached to the same number at around 5000 (5)after a slight rise over five years .A significant number of thefts was(were) reported in Great Britain in 1990 which was more than double of the other three countries. Starting from the lowest figure, (thefts in) Sweden outraced France and Canada in an upward direction and reached approximately 15000 (15) in 1999,which was two times higher than France and Canada. With the exception of a steady decline and rise in 1993 and 1996 respectively, Great Britain experienced a steady drop in the number until 1999 which was roughly similar to the initial period.
Feedback:
A good attempt! However the data interpreted is incorrect. Numbers are per thousand not in thousands so the figures stated in the response are all incorrect. In the 2nd paragraph it should be half and not twice which has made the response incomprehensible. A decline will be in thefts and not the country as written in the 3rd paragraph. Some Grammar errors can be seen in the response which have been emboldened above.
Band Score : 1.5/3
-
-
Unknown Member
Deleted UserOctober 21, 2021 at 3:46 PMThe line graph provides information about motor vehicle stealing in four different countries from 1990 to 1999.The figures mentioned are in theft per thousands vehicles.
Great Britain had the highest vehicle stealing throughout the years while Sweden showed an increasing trend. However, France and Canada stood lower with slight fluctuations .
In France and Canada, nearly 8000 cars were stolen in the year 1990 which was twice lower than Great Britain. Following that, both countries had a slight fall in thefts for the next three years until 1993. Meanwhile, a sharp decline can be observed in Great Britain as well in the same year. After that, car robbery in Canada almost levelled off till 1999.France also reached to the same number after a slight rise over five years.
A significant number of thefts was reported in Great Britain in 1990 which was more than double of the other three countries. Starting from the lowest figure, Sweden outraced France and Canada in an upward direction and reached at around 15000 in 1999,which was two times higher than France and Canada. With the exception of a steady decline and rise in 1993 and 1996 respectively, Great Britain experienced a steady drop in the number until 1999 which was roughly similar to the initial period.
-
Unknown Member
Deleted UserOctober 21, 2021 at 7:47 PMThe line graph provides information about motor vehicle stealing in four different countries from 1990 to 1999.The figures mentioned are in theft per thousands vehicles. <div>
Great Britain had the highest vehicle stealing throughout the years while Sweden showed an increasing trend. However, France and Canada stood lower with slight fluctuations
In France and Canada, nearly 8000 cars were stolen in the year 1990 which was twice lower than Great Britain. Following that, both countries had a slight fall in thefts for the next three years until 1993. Meanwhile, a sharp decline can be observed in Great Britain as well in the same year. After that, car robbery in Canada almost levelled off till 1999.France also reached to the same number after a slight rise over five years.
A significant number of thefts was reported in Great Britain in 1990 which was more than double of the other three countries. Starting from the lowest figure, Sweden outraced France and Canada in an upward direction and reached at around 15000 in 1999,which was two times higher than France and Canada. With the exception of a steady decline and rise in 1993 and 1996 respectively, Great Britain experienced a steady drop in the number until 1999 which was roughly similar to the initial period.
</div>
-
Unknown Member
Deleted UserNovember 1, 2021 at 5:58 AMThe line graph illustrates thousand’s of vehicles was theft’s in Great Britain , Sweden, France and Canada among 1990 to 1999
Overall, I want to lift the curtain up with Sweden, from 1990 to 1999 Sweden lies up word trend and remain other three countries moves to down word trend. Great Britain and France took place a huge fluctuations through out the graph.
To begin with Great Britain, it lies at threshold point in the graph. In 1990’s Britain stood at almost 17,000 and gradually increased to 19,000 in 1993. After 1997 the Britain stretched to down word trend and nearly reached to 16,000.
In addition, Sweden touched approximately 9000 in 1990 and stood at 2nd position . In 1991 Sweden and France interest nearly at 8000. After 1991 France gradually decreased nearly to 6500 in the year 1993, after 1995 France moved to words down word trend, from 1990 to 1999 France took place a huge fluctuations and it interjected with Canada at nearly 6000 in 1999. In 1990 Canada stood at almost 7000 and moved to down word trend and hit 5000 in 1993
-
Observations :
The response has several Grammar and spelling errors . It is suggested that you refer to some sample answers before writing your response. Sentence framing needs a lot of improvement as most of the sentences are incorrectly framed and are not able to convey the message . You need personal guidance in writing.
-
-
Unknown Member
Deleted UserNovember 12, 2021 at 6:12 PMThe given line graph illustrates the robberies of vehicles in Great Britain, Sweden, France and Canada from 1990 to 1999, a period of nine years. Overall, the cases of vehicle robberies in Great Britain, France and Canada minimally fell, whereas the robberies in Sweden went up.
In 1990 Great Britain recorded the highest thefts of vehicles with approximately 18 per thousand vehicles, followed by Sweden, Canada and France. After a few fluctuations the cases in Great Britain decreased to nearly 16 thefts per1000 vehicles, on the other hand Canada and France were showing approximately the same counts, except in the interval between 1993 to 1999 in which the robbery cases in Canada was leveled off with approximately 5 thefts per 1000 vehicles but in France it reached a high of nearly 7 thefts per thousand vehicles and slightly came down at the same count of Canada.
In contrast to this Sweden was showing upward trend. However apart from a brief leveled off between 1996 to 1998, the robbery cases in Sweden rapidly escalated till 1999 with nearly 12 thefts per 1000 vehicles. Despite of this rapid increment the theft cases in Sweden was still less than that of Great Britain.
-
The given line graph illustrates the robberies of vehicles in Great Britain, Sweden, France and Canada from 1990 to 1999, a period of nine years. Overall, the cases of vehicle robberies in Great Britain, France and Canada minimally fell, whereas the robberies in Sweden went up.
In 1990 Great Britain recorded the highest thefts of vehicles with approximately 18 per thousand vehicles, followed by Sweden, Canada and France. After a few fluctuations the cases in Great Britain decreased to nearly 16 thefts per1000 vehicles( at the end of the period) . on( On) the other hand Canada and France were showing approximately the same counts, except in the interval between 1993 to 1999 in which the robbery cases in Canada was leveled off with approximately 5 thefts per 1000 vehicles but in France it reached a high of nearly 7 thefts per thousand vehicles and slightly came down at the same count of Canada. ( This sentence is not framed properly and is ambiguous in meaning.)
In contrast to this Sweden was showing ( showed an) upward trend. However apart from a brief leveled off ( level off) between 1996 to 1998, the robbery cases in Sweden rapidly escalated till 1999 with nearly 12 thefts per 1000 vehicles. Despite of this ( Despite this) rapid increment the theft cases in Sweden was(were) still less than that of Great Britain.
Feedback:
A good attempt ! The response is well structured and organized .A good effort has been made to answer the question and describe the main points in the charts . Range and vocabulary are satisfactory with good use of language of variation, comparision and contrast . Despite all this there are Grammar errors seen in tenses and conjunctions . Sentence framing also needs improvement in some places as it is adding ambiguity to the sentence meaning.
Band Score: 1.5/3
-
-
Unknown Member
Deleted UserNovember 16, 2021 at 2:39 PMThe given line graph illustrates the robberies per thousand vehicles in Great Britain,Sweden,France and Canada from 1990 to 1999.Overall,it can be clearly seen that Great Britain had highest number of vehicle thefts throughout the ten year period.
In early 1990 France and Canada had almost equal number of recorded vehicle robberies of about 6 and 7 per thousand respectively.After that there was a continuous rise in the vehicle thefts in France till mid 1991 when it reached a number of around 9 per thousand which was eqal to that of Sweden at that time.Thereafter the number remained greater than Canada till the end where they both finished at around 6 per thousand.
In Sweden besides a slight decline till mid 1991 and levelling off from 1996 to 1998 there was a constant increase in the count of thefts till it reached a number of about 14 per thousand at the end of period.
In Great Britain the figure of recorded vehicle robberies was by far the highest among the four countries.This count was around 18 and 17 per thousand at the beggining and end of the period respectively.
-
The given line graph illustrates the robberies per thousand vehicles in Great Britain, Sweden, France and Canada from 1990 to 1999.Overall,it can be clearly seen that Great Britain had highest number of vehicle thefts throughout the ten year period.
In early 1990 ( 1990s) France and Canada had almost equal number of recorded vehicle robberies of about 6 and 7 per thousand respectively. After that there was a continuous rise in the vehicle thefts in France till mid 1991 when it reached a number of around 9 per thousand which was eqal (spelling) to that of Sweden at that time. Thereafter the number remained greater than Canada till the end where they both finished at around 6 per thousand.
In Sweden besides a slight decline till mid 1991 and levelling off from 1996 to 1998 there was a constant increase in the count of thefts till it reached a number of about 14 per thousand at the end of period.
In Great Britain the figure of recorded vehicle robberies was by far the highest among the four countries. This count was around 18 and 17 per thousand at the beginning (spelling) and end of the period respectively.
Feedback:
Well attempted! The answer is well written and contains some good arguments. Point of view remains clear throughout. The message is easy to follow and ideas are arranged well with good use of cohesive devices. There is good coverage of the data and a brief reference to contrasting trends. There is a wide range of structures that are well handled with only small problems in the use of vocabulary, mainly in the areas word choice and spellings.
Band Score: 2.5/3
-
-
Unknown Member
Deleted UserNovember 20, 2021 at 3:32 AMFrom 1990 to 1999, the line graph compares the number of thefts per 1000 cars in four countries (Great Britain, Sweden, France, and Canada). Overall, the amount of stolen cars demonstrated almost the same trend in France and Canada over the period given whilst it rose gradually in Sweden. Throughout the 9-year timescale, it can be seen that theft cases in Great Britain were significantly higher than those of the other three countries.
In 1990, the number of stolen cars stood at approximately 6 in both Canada and France, being lower than that of the other two countries and afterwards, it experienced slight fluctuations finishing the period at the same level that it began. Likewise, the number of stolen vehicles in Great Britain experienced fluctuations. In the first year, it stood at about 18 after which reached a high of 20 in 1996, finishing the period at around 17.
In sharp contrast to this, the figure for Sweden increased gradually until 1996 apart of the brief fall occurred in 1991 and then it levelled off over three years after which reached a peak of approximately 13 in the final year.
-
Unknown Member
Deleted UserNovember 20, 2021 at 12:24 PMFrom 1990 to 1999, the line graph compares the number of thefts per 1000 cars in four countries (Great Britain, Sweden, France, and Canada). Overall, the amount of stolen cars demonstrated almost the same trend in France and Canada over the period given whilst it rose gradually in Sweden. Throughout the 9-year timescale, it can be seen that theft cases in Great Britain were significantly higher than those of the other three countries.
In 1990, the number of stolen cars stood at approximately 6 in both Canada and France, being lower than that of the other two countries and afterwards, it experienced slight fluctuations finishing the period at the same level that it began. Likewise, the number of stolen vehicles in Great Britain experienced fluctuations. In the first year, it stood at about 18 after which reached a high of 20 in 1996, finishing the period at around 17.
In sharp contrast to this, the figure for Sweden increased gradually until 1996 apart of the brief fall occurred in 1991 and then it levelled off over three years after which reached a peak of approximately 13 in the final year.
-
From 1990 to 1999, the line graph compares the number of thefts per 1000 cars in four countries (Great Britain, Sweden, France, and Canada). Overall, the amount of stolen cars demonstrated almost the same trend in France and Canada over the period given whilst it rose gradually in Sweden. Throughout the 9-year timescale, it can be seen that theft cases in Great Britain were significantly higher than those of the other three countries.
In 1990, the number of stolen cars stood at approximately 6 in both Canada and France, being lower than that of the other two countries and afterwards, it(they) experienced slight fluctuations finishing the period at the same level that it(they) began. Likewise, the number of stolen vehicles in Great Britain experienced fluctuations. In the first year, it stood at about 18 after which reached a high of 20 in 1996, finishing the period at around 17.
In sharp contrast to this, the figure for Sweden increased gradually until 1996 apart of the brief fall (apart from a brief fall that )occurred in 1991 and then it levelled off (for)over three years after which (it)reached a peak of approximately 13 in the final year.
Feedback:
Well written. Organisation and structure is good with ideas well arranged in the response. Language of comparision and contrast is used well with limited use of cohesive devices with a scope of improvement. Grammar errors are evident with incorrect use of prepositions and pronouns in some places.
Band Score : 2/3
-
-
Unknown Member
Deleted UserDecember 20, 2021 at 5:20 PMThe line graph represents robbery information per thousand cars from 1990 to 1999 in Great Britain , Sweden , France and Canada.
Overall, Great Britain shows that the vehicles thefts were higher than in other 3 countries from 1990 to 1999, while in Sweden this rate rose noticeably through the 9 years period .
According to the given graph ,approximately 17 vehicles were stolen in Great Britain in the year 1990 ,also , it is clearly seen 2 peaks in 1992 and 1996 that steadily climbed by approximately 3% and 4% ,however , despite some fluctuations inbetween throughout period , the number was almost the same in the end 1999. While in countries such as France and Canada car robbery rates remained almost constant with some minor fluctuations through the 9 years period .
Sweden on the other hand , the only country where automobile thefts enormously increased between 1990 and 1999 . It started from 7 vehicles in 1990 and double up to 14 cars in the end.
-

1992 and 1996 that steadily climbed by approximately 3% and 4% (respectively)
It started from 7 vehicles (per thousand) in 1990 and double up to 14 cars in the end.
Feedback : well -written , though you could explain the trends by mention figures in featuring paragraphs.
Band: 2/3
-
-
The bar graph provides the information relating to car theft per thousand for vehicles in Great Britain, Sweden, France and Canada from the year 1990 to 1999. Overall, it shows Great Britain had the highest number of robberies throughout the given period in comparison to other countries. The bar graph shows France and Canada which began from figures of approximately 8 and 7 per thousand respectively declined to a final figure of around 5 per 1000 in 1999 with minor fluctuations over the period.
On the other hand, Sweden crime rates shows a rising trend from 8 to 13 per 1000 vehicles in 1999, surpassing France and Canada in mid-1990 and 1991 respectively.
In contrast to this, the number of car robberies in Great Britain grew up from about 17per 1000 to the peak value of approximately 20per 1000 in 1996 except for a brief fall during 1992-1993.
 graph provides information regarding thefts per thousand for vehicles in Great Britain, France, Sweden, and Canada from 1990 to 1999. Overall, the thefts have declined for Great Britain, France, and Canada whilst it rose for Sweden throughout.
Log in to reply.


