-
Academic writing part 1 Ipshita 8pm4
Posted by Ipshita on July 13, 2021 at 8:31 PMYou should spend about 20 minutes on this task.
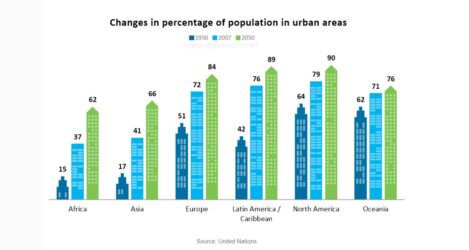
The bar chart below gives information about the percentage of the population living in urban areas in different parts of the world.
Summarise the information by selecting and reporting the main features, and make comparisons where relevant.
Write at least 150 words.
Aman replied 3 years ago 4 Members · 3 Replies -
3 Replies
-
The bar chart illustrates the migration trend of people in to the urban areas in various part of world over 100 years.
Overall, the trend seems to be quite high for the developed countries like Europe, Lain America, North America and Oceania in comparison to the other parts of the county like Africa and Asia.
For Europe, Latin America, North America & Oceania around half of the population were living in the developed areas i.e. 51% , 42%, 64% and 62% respectively. However figure showed a significant growth in people shifting to city area by 2007 reaching to 72%, 76%, 79% and 71% respectively. The same trend is anticipated for the another 4 decades and expected to touch around 84% in Europe, 89% in Latin America, 90% in North America and 76% in Oceania by end of 2050.
However, such trend showed less popular for the
other counties like Africa & Asia. In 1957 the rate for urban population in
those countries were around 15% & 17% only. Although By 2007 the percentages had almost
double reaching to 37% in Africa and 41%in Asia, it was still much lower in comparison
to the other countries. By end of 2050 the steady growth in the migration percentage
is anticipated & expected to touch to around 62% & 66% respectively -
The bar chart provides information about the changes in proportion of the population residing in urban areas in various parts of the world during the timeline of 1950 to 2050.
Overall, Africa, Asia and Latin America/Caribbean experienced a drastic change in percentage of population living in urban areas for the given timeline as compared to Europe, North America and Oceania. These continents (Africa, Asia and Latin America) witnessed a huge increment of people preferring to live in urban areas. Africa experienced the highest increment of people shifting to urban areas, whereas Oceania experienced the least amount of people moving to urban areas.
In Africa, there was a significant surge in percentage of people living in urban areas as the number rose from 15% in 1950 to 62% in 2050.Similarly, for Asia and Latin America more and more people shifted to urban areas as there was a increment of 49% and 47% respectively in the proportion of people moving to cities.
On the other hand, Europe, North America and Oceania experienced a less proportion of people moving to urban areas as compared to Africa, Asia and Latin America. For Europe, there was a 33% increment in the number of people shifting to urban areas from 1950-2050.Moreover,for North America and Oceania the increment in the population shifting to urban areas was the least among all the countries as only 26% and 14% people moved out.
-
The provided bar graph depicts the comparison of 6 different countries in terms of population from 1950 till 2050.
Overall, it is manifested from graph that there was a drastic increase in the world’s population in 5 region over the two centuries. Also, some variations have been noticed in terms of growth pattern of dwellers.
To commence with, Asia and Africa experienced rapid growth as its population is expected to rise in future by approximately 50% ranging from 1950 to 2050. A steady change was marked in population with an increase of 9% from 62%to71% and it is forecasted by experts that proportion of people will escalates in future projections in 2050.
No significant improvements have been observed in region of Latin America and Caribbean,as its figures were considerably low (42%) than that of Eurpeans (50%).Meanwhile,North America is more likely to follow ascending trend in upcoming years too ranging from 64%to90% in between 1950 to 2050.
Log in to reply.


