-
IELTS ACADEMIC WRITING TASK 1 (AIR POLLUTION)
Posted by NIL Admin on July 26, 2021 at 10:54 PMYou should spend about 20 minutes on this task.
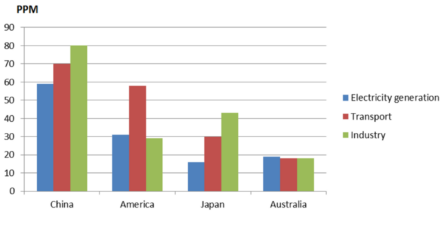
The charts shows air pollution levels by different causes among four countries in 2012.
Summaries the information by selecting and reporting the main features, and make comparisons where relevant.
You should write at least 150 words.
Aishwarya replied 1 year, 8 months ago 5 Members · 6 Replies -
6 Replies
-
-
Praveen, this is not the actual way to write a report in Ielts. Do not put any opinion or conclusions or inferences anywhere. The first line that you started with is an opinion which is not going to work here. You need to prepare a report. I will write another report here look at that and take example
-
-
Sample from another student:
The bar chart compares and contrasts data on the differences tin the levels of air pollution in terms of 3 various causes: electricity generation, transport and industry in China, America, Japan and Australia in 2012, measured in PPM.
A closer look at the bar chart highlights the fact that China had the most polluted air while Australia’s atmostphere was the least pollution compared to other places. Besides, electricity generation produced the lowest levels of air pollution, expected Australia.
Looking at China and Japan, industry was the greatest factors of all, with 80 PPM and nearly 43 PPM respectively, while electricity manufacture caused the least in both countries, around 59 PPM and 15 PPM. 70 PPM was caused by transportation in China which was 2 times more than that one in Japan ( 30 PPM).
With different trend, America was the only nation where transpotation was the highest effect of air pollution, bringing the value up to approximately 58 PPM, followed by industry and electricity generation, at 38 PPM and 30 PPM, respectively.
In contrast, the 3 figures in Australia showed a relatively similar effect on air pollution, being under 20 PPM, around 18 PPM in transportation and industry and nearly 19 PPM for generating electricity.
-
The given bar graph illustrates the contribution of three main sources of air pollution among China ,America ,Japan and Australia .
Major source of pollution in China and Japan is industries as compared to America where transport is the leading cause,however Australia has equal contribution from all three sources. The contribution of electricity in increasing air pollution levels is least in all countries except Australia where electricity exceeds slightly amongst others .
In China transportation leads electricity by 10 ppm and lags behind by industrial emission by 10 ppm for raising air pollution levels .On the other hand in America transports causes 30 ppmmore pollution than its counterparts.
Industries hive rise to approximately 40 ppm air pollution levels in Japan as compared to the transport and electricity which are 30 and 15 ppm respectively . At last, in Australia all three causes contribute equally which is 20 ppm .
To summarise ,China is the leading in contribution to increasing level of air pollution among all three nations with Australia contributing the least .