NIL Community

Find answers, ask questions, and connect with our
community around the world.

  • IELTS Academic Writing Task 1/ Graph Writing – Bar/Column Graph:

    Posted by NIL Admin on August 20, 2021 at 10:51 PM

    IELTS Academic Writing Task 1/ Graph Writing – Bar/Column Graph:

    » You should spend about 20 minutes on this task.

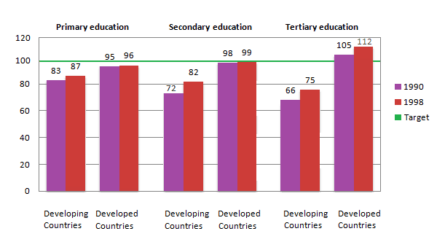
    The chart below shows the number of girls per 100 boys enrolled in different levels of school education.

    Summarise the information by selecting and reporting the main features and make comparisons where relevant.

    » Write at least 150 words.

    Student Example: 2.5 Bands IELTS

    The charts compare the number of female students in comparison with their male peers in all three levels of education between developing and developed nations in two years 1990 and 2000.

    It is clear that the biggest difference between two types of countries can be seen in tertiary sector. Moreover, developed countries’ figures were closer to the 2005 targets than developing nations’.

    In 1990, there were 83 girls in developing countries attended primary, while the number for developed countries was 93 students. As regard to secondary sector, while the figure for developing countries was 72 girl students, 98 female students in developed countries enrolled in secondary school. The developed countries’ highschool figure were stood at 105 students, while only 66 of their peers in developing countries went to school.

    In 2000, both figures in elementary sector witnessed rises, with 4 students in developing nations and 3 girls in developed nations. However, developing countries’ secondary education had the most dramatic change, to 82 students in 2000, compared to a 7 students increase in the developed countries’ tertiary education.

    NIL Admin replied 2 years, 8 months ago 3 Members · 4 Replies
  • 4 Replies
  • Aniket

    Member
    August 23, 2021 at 11:51 AM

    The bar chart depicts the different sectors of education with the enrolment figures of girls per 100 boys in the year 1990 and 1998 respectively. It was lucid that the developed countries has outperformed the developing countries in all three modes of education, and also easily achieving the target in tertiary education sector.

    Categorically speaking, the figures for developed countries had steadily increased from primary to tertiary crossing the target 5 times and around 0.12 percent per 100 boys, in the year 1990 and 1998 respectively. With primary education being the lowest roughly 5 or 4 less than 100 in both the years correspondingly. Moreover, secondary education was approximately close to 100 in both years.

    The data for developing countries suggest that only in case of primary sector, they were able to cross above the 80 limit per 100 boys, while in case of secondary education, only in 1998 the figures climbed just over 80, with eight less than eighty in 1990. On the other hand, the tertiary was the worst among all with exactly 3 quarters in 1998 and less than three quarters in the year 1990.

    Overall, the general trend suggests that only developed nations were able to achieve the target, while developing countries had not seen a good rise in any of the sectors and remained under the target.

  • shakshi

    Member
    August 23, 2021 at 6:34 PM

    The bar chart illustrates number of females enrolled in comparison with males students in primary, secondary and tertiary education for developed and developing nations between 1990 and 1998 respectively.

    Overall, it is clearly observed that developed countries had outraced developing nations in all the educational sectors. Furthermore, higher education had excelled in girls admission in developed countries by achieving the target margins.

    Firstly in 1990, developing counties indicated a raised of 83 females in primary education whereas other two sectors had shown a dropped in numbers with small majority. Subsequently, in developed territory the figure was 95 and 98 in primary and secondary but in tertiary it was noticed a slightly increase in number of girls per 100 boys.

    Secondly, in 1998, tertiary had climbed the target with 112 students more than men ratio in developed countries but on the other hand developing countries had plummeted by nearly one third. In primary and secondary education the numbers were at 87 and 82 in developing nations and 96 and 99 in developed nation.

Log in to reply.

We are here to help

Conversational Form (#3)