
-
IELTS Task 1 ( Academic ) Revenue Sources and Expenditures of a USA Charity
Posted by Unknown Member on August 20, 2021 at 11:53 AMYou should spend about 20 minutes on this task.
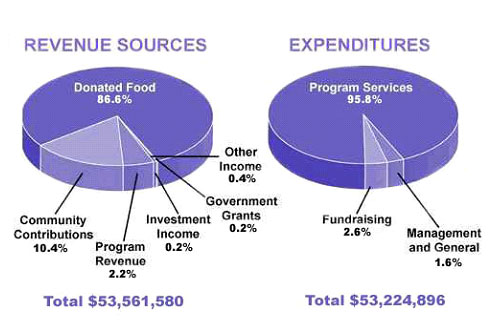
The pie chart shows the amount of money that a children’s charity located in the USA spent and received in one year, 2016.
Summarize the information by selecting and reporting the main features and make comparisons where relevant.
Write at least 150 words.
Revenue Sources and Expenditures of a USA Charity in one year, 2016.
 Unknown Member replied 4 years, 8 months ago 5 Members · 8 Replies
 -
8 Replies
-

Unknown Member
Deleted UserAugust 24, 2021 at 11:02 PMThe charts depicts the money expend and generated for children’s charity in the particular country USA for a single year, 2016. Overall, it is conspicuous that there are approximately 6 revenue streams as opposed to the expenditures. Moreover, the collection of amount collected from different sources are slightly greater than the spend amount.
As it is presented in the pie chart, the donated food accounts for 86.6% while other income, government grants, and investment income covers only a tiny fraction. Moreover, community contributions constitutes (10.4 percent) than program revenue which makes up only a small portion (2.2%).
In terms of expenditures, the spends were more on program services holding a very large proportion. On the contrary, fundraising, management and general holds only a small fraction.(2.6% and 1.6% respectively).
Overall, it could be plainly viewed that total amount collected through the income model is roughly around 53.5 million while payouts accounts for a total of roughly 53 million.
-
The charts depicts the money expend and generated for children’s charity in the particular country USA for a single year, 2016. Overall, it is conspicuous that there are approximately 6 revenue streams as opposed to the expenditures. Moreover, the collection of amount collected from different sources are (is) slightly greater than the spend amount.
As it is presented in the pie chart, the donated food accounts for 86.6% while other income, government grants, and investment income covers only a tiny fraction. Moreover, community contributions constitutes (10.4 percent) than program revenue which makes up only a small portion (2.2%). ( Moreover Community contributions and program revenue contributes 10.4% & 2.2% which makes up only a small portion of the total revenue sources.
In terms of expenditures, the spends were more on program services holding a very large proportion. On the contrary, fundraising, management and general holds only a small fraction.(2.6% and 1.6% respectively).
Overall, it could be plainly viewed that total amount collected through the income model is roughly around 53.5 million while payouts accounts for a total of roughly 53 million.
Feedback:
The answer has an appropriate introduction which has been attempted to be expressed in his/her own words. There is good coverage of the data and a brief reference to contrasting trends. The answer can be followed easily. In order to gain higher marks for content, it would be expected to select the salient features of the graph and comment primarily on these. Sentences are long but lack complexity. There are some errors in tense, verb form and sentence formation which interfere slightly with the flow of the answer.
Band Score: 2/3
-
-
Unknown Member
Deleted UserAugust 25, 2021 at 9:56 AMThe pie chart represents monetary spending of expenditures and receiving revenue from different sources of children’s charity in USA for the year 2016. Looking from an overall perspective, offering from eatable items and program services had incurred the maximum charitable money in revenue and expenditures within one year.
Firstly, community had contributed a small majority of amount i.e. 10.4% whereas investment income, government grants, and other income covered 0.8% which identified as a tiny fraction of donations. However, Programs brought 2.2% of revenue in 2016 respectively. Secondly, program services had spent 95.8% of his charitable income, while fundraising, management and general payed 2.6% and 1.6% from the total amount.
It is crystal clear that the expenditures were segregated
in three parameters with spending of total 53.22 million dollars, whereas revenue
on other hand was collected from six different sources amounting to 53.56
million dollars. Moreover, it was predictable that income from different sources was more than spending capacity in the year 2016.-
Feedback:
Although the script contains some good arguments, these are presented using poor structures and the answer is not very coherent. You have a clear point of view but not all the supporting arguments are linked together well and sometimes ideas are left unfinished. There is quite a lot of relevant vocabulary but this is not used skilfully and sentences often have words missing or lapse into different styles. The answer is spoilt by grammatical errors and poor expression
Band Score : 1.5/3
-
-
Unknown Member
Deleted UserOctober 22, 2021 at 4:33 PMThe bar chart illustrates the revenue sources and expenditures of a children’s charity situated in the USA in a year 2016 in percentage.<div>
<div><div>
At a glance, it is clear that income from five different sources outweigh the expenses and the major contribution was foodstuff whereas they spent more on programme services.
Spending on management as well as general needs were the lowest at 1.5% along with fundraising which cost only 2.6%. Additionally, a significant proportion spent was on programme services at 95.8%, on contrary revenue from programme hold a very small proportion.
Food contribution alone generated a substantial source of earnings at 86.6% which showed only one in ten difference from the largest expenditure on programme services. The second largest place of revenue was from community sources which accounted for 10.4% and an insignificant proportion was provided by other sources.
</div></div></div>
-
The bar chart (pie charts )illustrates (illustrate)the revenue sources and expenditures of a children’s charity situated in the USA in a year 2016 in percentage.<div>
<div>
At a glance, it is clear that income from five different sources outweigh the expenses and the major contribution (contributor to Revenue Sources was Donated Food) was foodstuff whereas they (it) or (Charity) spent more on programme services.
Spending on management as well as general needs were (was) the lowest at 1.5% (1.6%) along with (followed by) fundraising which cost only 2.6%. Additionally, a significant proportion spent was on programme services at 95.8%,(.) (On) on (the )contrary revenue from programme hold(held) a very small proportion.</div>(On the other hand) Food contribution alone generated a substantial source of earnings at 86.6% which showed only one in ten difference from the largest expenditure on programme services. The second largest place of revenue was from community sources which accounted for 10.4% and an insignificant proportion was provided by other sources.
Observations :
1. It’s a pie chart and not a bar chart as mentioned in the introduction.
2. It should be pie charts illustrate.
3. Rest of the corrections are in bold above
Feedback:
The response to the question is not long enough. For Task 1 candidates must write at least 150 words but this answer is below that number. The writing is presented in a satisfactory format but there is a serious error about the kind of chart shown in the introduction which greatly limits the score. The points made in the answer are relevant to the question but could be developed. The candidate does not complete the requirements of the task because there is no clear overview. The writer shows some awareness of sentence structure however, there are frequent grammatical errors throughout the answer The answer flows quite smoothly although connectives are used less, and some of the points do not link up well. The grammatical accuracy is lacking in subject verb agreement and tenses. Language of comparision and contrast has been used well.
Band Score:1.5/3
</div>
-
-
Unknown Member
Deleted UserNovember 28, 2021 at 12:31 PMThe given pie charts depict how a charity for children based in USA raised funds and where the collected money was spent,in the year of 2016.At first glance,it can be perceived that the major source of revenue was the donated food and the highest proportion of the collection was spent on program services.
A very large amount(86.6%) of the collected money was raised with the donated food alone, and the contributions of the community accounted for slightly over one-tenth of the total.On the other hand the earnings from program revenue,investment income,government grants and other sources were negligible( only 3% collectively).
At the same time the charity exhausted majority(almost 96%) of money on program services whereas a very small amount ,only 4.2% in total,was spent on fundraising and management and general purposes.
Also, it is very clear from the given pie charts that the received amount was greater than the expenditures,as they earned around 53.5 milliion dollars while they defrayed roughly 53.2 million dollars.
-
The given pie charts depict how a charity for children based in USA raised funds and where the collected money was spent, in the year of ( not required)2016.At first glance, it can be perceived that the major source of revenue was the donated food and the highest proportion of the collection was spent on program services.
A very large amount(86.6%) of the collected money was raised with the donated food alone, and the contributions of the community accounted for slightly over one-tenth of the total.
On the other hand the earnings from program revenue, investment income, government grants and other sources were negligible( only 3% collectively).
At the same time the charity exhausted majority(almost 96%) of money on program services whereas a very small amount ,only 4.2% in total, was spent on fundraising and management and general purposes.
Also, it is very clear from the given pie charts that the received amount was greater than the expenditures, as they earned around 53.5 milliion dollars while they defrayed roughly 53.2 million dollars.
Feedback :
Introduction and general overview are well written but comparisons and contrast have not been depicted well. Language of comparison and contrast has hardly been used. Variation in language could have been improved though there are negligible Grammar errors.
Band Score : 2/3
-
Log in to reply.


