-
IELTS Task 1: Crime in the City Center Line Chart
Posted by Isha Singha on June 16, 2022 at 8:33 PMLine Graph
Isha Singha replied 2 years, 1 month ago 3 Members · 4 Replies -
4 Replies
-
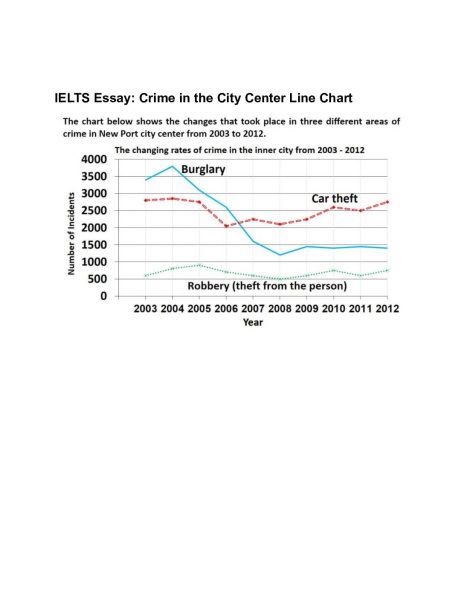
This graph details the number of crimes that were reported over the course of nine years, from 2003 to 2012.
In general, it is clear that the trends for auto theft and robberies have remained consistent within a certain range, while there has been a decline in the number of cases that involve burglary.
To start, the number of car theft events decreased somewhat between 2005 and 2006, settling at 2000 incidents. At the end of the timeframe that was 2003 to 2012, there was a rising trend that reached the greatest number of events recorded, which was 2700. While the number of robberies has fluctuated between 500 and 1000 cases since the beginning of the timeline, when it was around 600 in 2003, it finally settled at around 700.
The highest number of burglary incidents registered, reaching almost 3700, occurred in 2004. Between 2004 and 2008, there was a sharp dip, reaching about 1200. Subsequently, it rose and stayed steady between 1000 and 1500 from 2008 to 2012.
-
This graph details the number of crimes( mention where ) that were reported over the course of nine years, from 2003 to 2012.
In general, it is clear that the trends for auto theft and robberies have remained consistent within a certain range, while there has been a decline in the number of cases that involve burglary.
To start, the number of car theft events decreased somewhat between 2005 and 2006, settling at 2000 incidents. At the end of the timeframe that was 2003 to 2012, there was a rising trend that reached the greatest(highest) number of events recorded, which was 2700. While the number of robberies had fluctuated between 500 and 1000 since the beginning of the timeline, when it was around 600 in 2003, it finally settled at around 700.
The highest number of burglary incidents registered, reaching almost 3700, occurred in 2004. Between 2004 and 2008, there was a sharp dip, reaching about 1200. Subsequently, it rose and stayed steady between 1000 and 1500 from 2008 to 2012.
Feedback:
Nice attempt.
Avoid silly mistakes.
Bands – 2.5/3
-
-
The line chart here represents burglary, car theft and robbery in New Port City from 2003 to 2012.
Overall, there has been a sharp decline in the burglary whereas both car theft and robbery maintains a steady profile through the period. Robberies were least common throughout yet also rose marginally.
By the end of 2003 Burglary tops among both the other types of crime with incidents recorded above 3500. But it took a sharp decline thereafter and in the year 2008 it recorded less than 1500 cases, lower than car theft and with highest declination rate among other two areas of crime.
On the other hand if we look into the cases of car theft, it has also declined slightly in the number of cases from around 2700 to 2000 during the period of 2003 to 2006. From the year 2006 it started gaining upward trend in the increased number of cases and recorded back to over 2500 cases by the year 2012.
Robbery (theft from the person) maintained a sinusoidal profile with slight increased in the number of cases during the year 2004 and then decline gradually to 500 which marks the least cases recorded among other two types. By the end of 2012 when compared to burglary and car theft robbery remains with the lowest number of recorded cases.-
The line chart here represents burglary, car theft, and robbery in New Port City from 2003 to 2012.
Overall, there has been a sharp decline in burglary, whereas both car theft and robbery had maintained a steady profile through the period. Robberies were the least common throughout, but they also increased marginally.
By the end of 2003, burglary topped both the other types of crime, with incidents recorded above 3500. But it took a sharp decline thereafter and in the year 2008 it recorded fewer than 1500 cases, lower than car theft and with the highest declination rate among the other two areas of crime.
On the other hand, if we look into the cases of car theft, they declined slightly in the number of cases from around 2700 to 2000 during the period of 2003 to 2006. From the year 2006, it started gaining an upward trend in the increased number of cases and recorded back to over 2500 cases by the year 2012.
Robbery (theft from the person) maintained a sinusoidal profile with a slight increase in the number of cases during the year 2004 and then declined gradually to 500, which marks the least cases recorded among the other two types. By the end of 2012, when compared to burglary and car theft, robbery remained with the lowest number of recorded cases.
Feedback:
-Mistakes are marked in bold.
– Punctuation marks are important.
– Grammatical errors.
-Well Structured. Nice attempt
Bands – 1.5/3
-
Log in to reply.


