-
Neha Writing TAsk 1
Posted by Ipshita on March 28, 2022 at 8:28 PMThe table below shows the percentage participation of women in senior management in three companies between 1975 and 2015.
Summarise the information by selecting and reporting the main features, and make comparisons where relevant.
Write at least 150 words.
Ashish replied 2 years, 4 months ago 3 Members · 3 Replies -
3 Replies
-
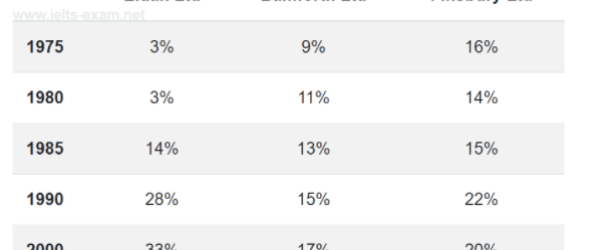
The table shows the percentage of women in senior management positions from 1975-2015.
Eldan Ltd. in 1975 is visibly lower percentage of 3% of women held senior positions in management. After 5 years the percentage has not been changed at all. In 1985 was increased up to 14%. In 1990 the percentage of seniors women was doubled by 28%. In the final year 2015, the results show enormous growth of 64% of women in senior department.
On the other hand, In Finsbury Ltd., the number of women who held senior positions was 16% in 1975. The extremely high percentage for that year, in contrast with that in the following 10 years it noticed a little bit of dropped to that percentage. in 1990 has risen up to 22% and in the final year, they reached 26%.
Looking at the Bamforth Ltd., the data shows us every year from 1975-2000 the women senior positions was increased by 2% every 5 years. However, in 2015 the women’s power in management reached 46%.
Overall, seeing all the graphs data we can see Eldan Ltd. had the most significant rise in senior women management position in all these 10 years.
-
The table shows the percentage of women in senior management positions in three companies from 1975 to 2015.
While more women were in senior positions at Finsbury Ltd than the other two companies in 1975 at 16%, the trend was fairly erratic with a 2% drop to 14% in 1980, followed by a rise of 1% five years later. In 1985 was increased up to 14%. In 1990, the percentage of seniors women was doubled by 28%. In the final year of 2015, the results show enormous growth of 64% of women in the senior department.
The extremely high percentage for that year, in contrast with that in the following 10 years it noticed a little bit of dropped to that percentage. in 1990 has risen to 22% and in the final year, they reached 26%.
Looking at Bamforth Ltd., the data shows us every year from 1975 to 2000 women’s senior positions was increased by 2% every 5 years. However, in 2015 the women’s power in management reached 46%.
Overall, seeing all the graphs data we can see Eldan Ltd. had the most significant rise in senior women management positions in all these 10 years.
By contrast, at Eldan Ltd women fared much better. In 1975, 3% of senior posts were occupied by women with no change five years on. By 1985, the figure had increased to 14%, doubling to 28% in 1990. Ten years afterwards, there was a 5% increase in female senior management jobs with a near twofold jump in 2015 to stand at 64%, the highest for the three companies.
The situation was less remarkable at Bamforth Ltd than the other two firms except for the year 2015. In 1975, the percentage of senior posts held by women was 9% climbing at the rate of 2% in each subsequent period until 2000, after which it leapt to 46%.
From the data, it is clear that women dominated senior posts at Eldan by 2015.
-
The given table illustrates how the number of women who participated in senior management in three companies changed over a period of 40 years from 1975 to 2015.Overall, it can be seen that by the end of the period, there was a boost in the proportion of women who held the senior positions in all the three companies , but it was most significant at Eldan Ltd.
In 1975, the number of women who were working at senior positions was highest for Finsbury Ltd as compared to the rest two, at 16%.But ,this figure decreased to 14% in the next five years followed by 1% rise five years later. In 1990, the women’s percentage rose by 7% but again decreased and stood at 20% in 2000.After 15 years, this percentage amounted to 26%.
On the contrary, a constant rise was observed in the Eldan Ltd and Bamforth Ltd companies, from the beginning to the end of the period. In the first five years, no change was noticed in Eldan Ltd as the data remained at 3%. By 1985, the figure had reached 14%, and doubled to 28% in 1990.Ten years later, an inclination of 5% was observed and it increased to almost twofold and became 64% in 2015.
Likewise, Bamforth Ltd was at 9% at the beginning and this percentage increased by a steady rate of 2% in every subsequent period till 2000, where it stood at 17% but after that it leapt to 46% by 2015.
Log in to reply.


